Contact

mail@gemini-theme.com
+ 001 0231 123 32

Follow

Info

All demo content is for sample purposes only, intended to represent a live site. Please use the RocketLauncher to install an equivalent of the demo, all images will be replaced with sample images.

Timing Techniques

The objective is to apply cyclic and linear trend smoothing techniques to the price and relative performance of the three market rhythms, long-term, intermediate- and short-term, as well as to secular trend. Simplicity is maintained by the use of only these few analytical tools. Smoothing techniques are applied in order to:

  • Eliminate the effect of random fluctuations of the cycle while leaving the larger and longer term fluctuations unaltered, thereby assisting in the recognition of the more sustainable trends.
  • Indicate trend junctures (reversals) and to identify low and high risk conditions leading to an assessment of probability for the new trend.
  • Identify periods of relative under and over performance in any price series and in particular at trend turning points.
  • Trends lacking relative strength improvement are rejected and are considered likely low magnitude performers (Magnitude Failures). Trend and Cyclic commonality and variation are recorded for the cyclic waves of the dominant long-term trend representing the 4 to 4-1/2 year cycle, the intermediate less dominant trend and the minor more random short-term trend waves. These three well-defined cyclic movements fit into each other and act together to form the cyclic model. Very long-term secular trend movements are tracked, analyzed and defined by character, type, maturity and timing juncture.
  • Determine cyclic position of the price series, monitor the rotational progression and sequential relationships occurring between individual series, groups, sectors and markets.

PRODUCTS (Varies with the services chosen)

  • Installation of on-line system from client’s personal computer to our mainframe computer.
  • System Manual, Code Book, Analytical & Methodology Training Manuals.
  • Ability for client to input own portfolios and/or investment universe to enable customized analysis. Use of our mainframe computer for client’s own series, measurement techniques and customized research.
  • Notley’s Notes – weekly information survey of capital markets is distributed to terminal users and hard copy subscribers via electronic mail and/or facsimile.

Hard Copy Research Products

  • Weekly - Notley’s Notes delivered by e-mail.
  • Fortnightly - Global Markets at a Glance and Global Groups at a Glance delivered by e-mail.
  • 2-3 Times a Year - Cyclic Phase Distributions found in global capital markets for rates, bonds, equities, currencies, commodities and business cycle.
  • Quarterly - Market Models by Visual Perspectives illustrating financial cycles and trends.
  • Annually - Perception and opportunity covering the prospects for the coming year accompanied by very long-term secular studies.

On Request by Special Arrangement

  • Customized service and reports on specific portfolios, universes, industries and markets.
  • lnformation and reviews with analysts – conference calls on a regular basis.
  • Training courses arranged with personnel.

Portfolio Management Strategies

  • Cyclic Rotation is monitored and analyzed for individual series, groups, sectors and markets as well as the longer term sequential relationship existing between interest rates, bonds, equity markets, currency, commodities and the business cycle. (Our approach is basically a top-down approach with allowance for a bottom-up style in the case of more rotational markets.)
  • Development of very long-term strategies and models on interest rates, bonds, equities, commodities and inflation/deflation covering the 20th century.

Diagnosing Trend & Cycle Rhythms

Time series movements consist basically of four measurements:

  • Secular Trend
  • Periodic Rhythm (seasonality)
  • Cyclical Forces
  • Irregular Movements (random noise)

Analyzing the Cyclical Force Components of Time Series Analysis

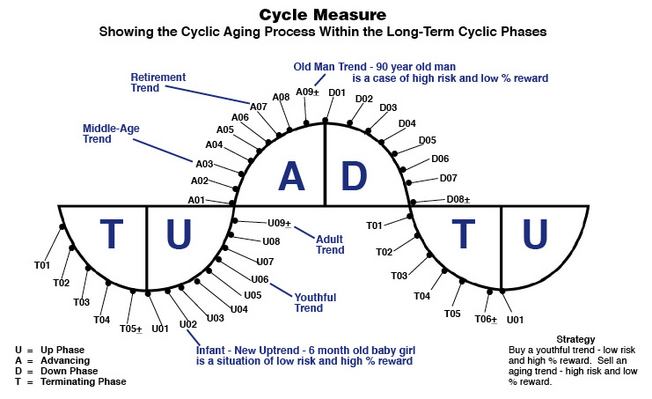
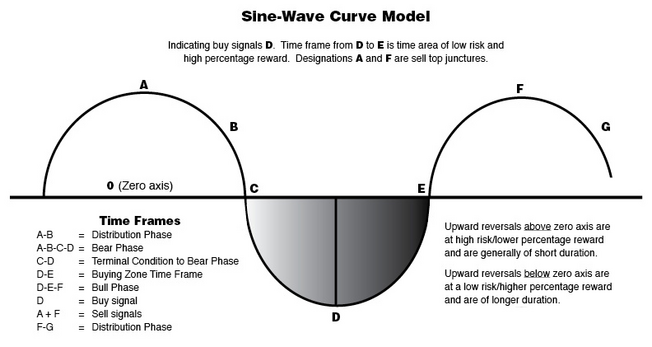
Ordinarily all cyclic movements are present, coexisting and blending, but not always equally, for sometimes one or more of the movements dominate to determine trend direction.Trend movements in bull and bear markets are analyzed as follows and are shown in our bell curve model:

  • Long-Term Trend (monthly chart) - Investor Strategy
  • Intermediate-term Trend (weekly chart) - Trading Strategy
  • Short-Term Trend (daily chart) - Timing Execution

Additionally, other characteristic involved are defining risk/reward time frame areas for all three cyclic rhythms:

  • Blending of the three market trend rhythms together to capture most price magnitude for a cycle by using summed cyclicality, focusing on the long term for cycle position (investor), intermediate term for strategy (trader), and short term rhythm for execution.
  • Monitoring the acceleration and deceleration of price trends and to determine the point-of-cycle of market position.

Objective

To capture 75%+ of the price amplitude of a cyclic advance or decline.

Interpretative Concepts

  • Trend Smoothing
  • Principles of commonality and variation
  • Forces of summed cyclicality
  • Domination of price motion by market sentiment
  • Time frame versus magnitude prediction

Limitations

  • General - There are not absolutes in stock and commodity market analysis
  • Specific - Subject to distortional effects of irregular movements (random noise) the fourth component of time series and subject to the effect of secular trend dominancy

SineWave Curve Model