
Diagnosing Trend & Cycle Rhythms
Time series movements consist basically of four measurements:
- Secular Trend
- Periodic Rhythm (seasonality)
- Cyclical Forces
- Irregular Movements (random noise)
Analyzing the Cyclical Force Components of Time Series Analysis
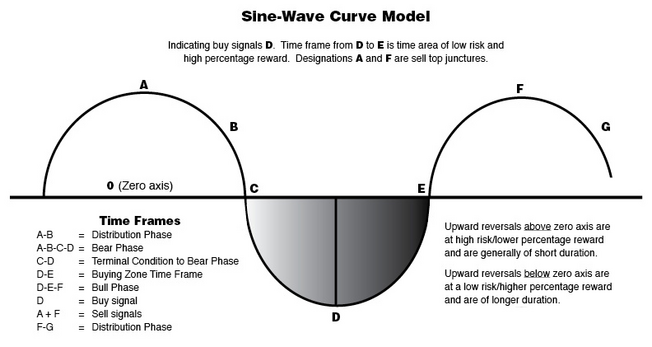
Ordinarily all cyclic movements are present, coexisting and blending, but not always equally, for sometimes one or more of the movements dominate to determine trend direction.Trend movements in bull and bear markets are analyzed as follows and are shown in our bell curve model:
- Long-Term Trend (monthly chart) - Investor Strategy
- Intermediate-term Trend (weekly chart) - Trading Strategy
- Short-Term Trend (daily chart) - Timing Execution
Additionally, other characteristic involved are defining risk/reward time frame areas for all three cyclic rhythms:
- Blending of the three market trend rhythms together to capture most price magnitude for a cycle by using summed cyclicality, focusing on the long term for cycle position (investor), intermediate term for strategy (trader), and short term rhythm for execution.
- Monitoring the acceleration and deceleration of price trends and to determine the point-of-cycle of market position.
Objective
To capture 75%+ of the price amplitude of a cyclic advance or decline.
Interpretative Concepts
- Trend Smoothing
- Principles of commonality and variation
- Forces of summed cyclicality
- Domination of price motion by market sentiment
- Time frame versus magnitude prediction
Limitations
- General - There are not absolutes in stock and commodity market analysis
- Specific - Subject to distortional effects of irregular movements (random noise) the fourth component of time series and subject to the effect of secular trend dominancy
Follow